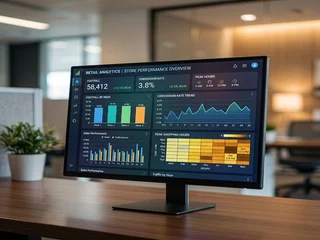
- Modern CCTV cameras with onboard analytics can provide business intelligence; footfall counts, heatmaps, dwell time, and customer flow, not just security footage.
- People counting reveals conversion rates; the ratio of visitors who entered to those who made a purchase, which sales figures alone cannot show.
- Heatmaps show where customers actually spend time in a store, which is often different from where the layout intended them to go.
- Staffing decisions based on analytics-measured peak periods are more accurate than those based on experience alone, and the difference can affect service quality and sales.
- Analytics identifies patterns. Human judgement explains them. The two work together rather than one replacing the other.
- The value comes from acting on the data, not from collecting it; a dashboard that nobody reviews delivers no benefit regardless of how sophisticated the technology is.
Most Retailers Buy Cameras for Security
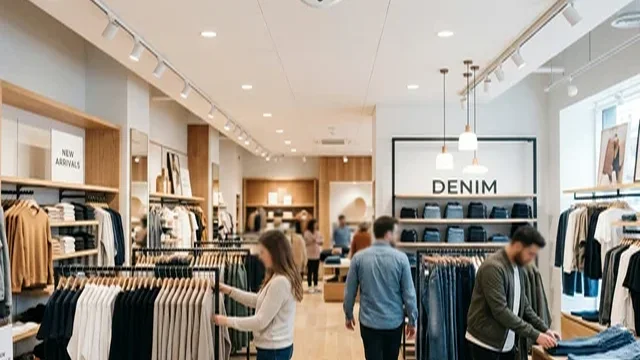
The usual reasons retailers install CCTV are entirely reasonable; theft prevention, loss investigation, staff safety, incident verification. These are genuine operational needs, and they justify the installation on their own. But over the past few years something has changed in what the cameras themselves are capable of doing, and many retailers have not yet noticed.
Modern cameras with onboard AI analytics can do significantly more than record video. They can count people entering and exiting, track where customers move within the store, identify which displays attract attention and which are ignored, and generate reports that answer business questions alongside security ones. Why does one outlet consistently outperform another with similar products and similar pricing? Which promotion drove more foot traffic, and did that traffic convert to sales? Is the store staffed correctly during its actual peak periods, or during the periods a manager assumed were peak based on habit?
These are not questions that security footage answers. They are questions that retail analytics; delivered by the same camera infrastructure already justified by the security case; can begin to address. For retailers planning a CCTV upgrade or new installation, understanding this additional capability is worth a few minutes of consideration before the specification is finalised.
KEY POINT
The security case for CCTV stands on its own. The analytics capability is an additional return on the same infrastructure investment, not a separate project requiring separate justification.
The Two Stores With the Same Sales Figure
Consider two retail outlets. Both generated S$20,000 in sales on the same day. By the standard measure; revenue; they performed identically. But the people counting data tells a different story. Store A received 200 visitors that day. Store B received 500 visitors.
Store A converted one in four visitors into a purchase. Store B converted one in twelve. Both reached the same sales figure, but through entirely different dynamics. Store A is performing exceptionally well at converting the customers who enter. Store B is attracting significant traffic; perhaps through location, signage, or promotion, but losing most of it before a transaction occurs. The interventions these two stores need are completely different. Store A's management should be studying what is working and whether it can be replicated. Store B's management should be investigating the conversion gap; is it pricing, product range, merchandising, customer service, or layout?
Without footfall data, both stores look identical. The sales figure is the same. The conversion gap is invisible. That is why people counting is often the first retail analytics capability I discuss with multi-outlet retailers, not because it is the most sophisticated tool available, but because it reveals the most fundamental question in retail operations: of all the people who walked in, how many left without buying?
KEY POINT
Sales figures measure what happened. Footfall data measures the opportunity that existed. The difference between the two is the conversion rate, and conversion rate is where most retail improvement work begins.
The Store Layout You Designed Is Not Always the Store Customers Use
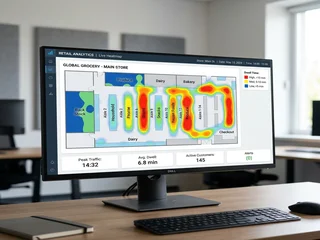
Heatmap analytics overlays customer movement and dwell time data onto a floor plan of the store, showing in a single visual where customers spend their time and which areas they pass through quickly or avoid entirely. What many retailers discover when they see this data for the first time is that the store they designed and the store their customers actually use are meaningfully different.
In a typical Singapore mall retail unit, the natural customer flow follows predictable patterns; usually along the main path from the entrance toward the back of the store, with attention concentrated near the entrance display and the checkout area. Secondary displays positioned along side walls or in back corners may receive far less attention than their placement on the floor plan suggests. A promotional display that management considers prominent may be effectively invisible to the majority of customers who enter the store and navigate by instinct rather than by the intended layout logic.
Heatmap data makes these patterns visible and measurable. A display that management assumed was performing well, because it is positioned near the entrance, may in fact be located in a dwell-time cold spot where customers pass without stopping. Moving that display three metres to a consistently high-dwell zone may produce a meaningful sales uplift with no additional inventory cost. Understanding where customers actually stop, look, and spend time; rather than where the planogram intended them to; is the foundation of data-informed merchandising.
KEY POINT
Heatmap data is most useful for identifying the gap between intended layout logic and actual customer behaviour. The gap is almost always present, and it almost always contains actionable opportunities.
The Staffing Problem Nobody Sees
Most staffing decisions in retail are based on a combination of experience, historical sales data, and intuition. This works reasonably well, but it is vulnerable to a specific and common error: the assumption that sales peaks and footfall peaks occur at the same time. They frequently do not.
Consider a Singapore retail outlet in a suburban mall. The manager schedules the largest team for the period between 1pm and 3pm on weekday afternoons, based on the experience that this period typically generates the highest sales. The people counting data reveals that the actual footfall peak; the period when the most customers enter the store; is consistently between 12pm and 1pm, during the lunch hour. By the time the peak sales period arrives at 1pm, many of the customers who entered at 12pm have already made their decision and left. The period with the highest staffing does not align with the period of highest customer arrival.
The practical consequence is a service quality gap during the actual peak arrival window, and overstaffing during the period when customer density has already declined. Adjusting the roster by a single hour; based on analytics data rather than sales data; improves the customer experience during the busiest arrival period and redistributes staff cost more efficiently. Across multiple outlets, these adjustments compound into meaningful improvements in both customer satisfaction scores and labour cost efficiency.
KEY POINT
Sales data shows when purchases occur. Footfall data shows when customers arrive. These are related but not identical, and staffing to the wrong peak has a direct effect on service quality and conversion.
Did the Promotion Actually Work?
Marketing effectiveness in retail is notoriously difficult to measure precisely. When a promotion produces a sales increase, the natural conclusion is that it worked. But the sales increase alone does not reveal the mechanism; whether more people visited, whether existing customers spent more, or whether the promotion happened to coincide with a seasonal uplift that would have occurred regardless.
People counting data allows the question to be split into its component parts. By comparing footfall during the three weeks before a campaign, during the campaign itself, and in the two weeks following, it is possible to determine whether the promotion actually drove more people through the door or whether the sales increase came from higher spend per visit among the same volume of customers. These are very different marketing outcomes. A promotion that increases spend per visit without changing footfall suggests the campaign was most effective with existing customers. A promotion that significantly increases footfall suggests it reached and attracted new or lapsed customers.
For retailers operating across multiple Singapore mall locations with varying footfall characteristics, this kind of campaign analysis allows marketing spend to be directed more accurately; identifying which outlet types, which locations, and which campaign formats drive the most incremental visits, rather than averaging the result across a portfolio and drawing conclusions that may not apply to any individual outlet.
KEY POINT
A sales increase after a promotion tells you it may have worked. Footfall data before, during, and after tells you how it worked, which is the information needed to decide whether to repeat it, scale it, or adjust it.
What Analytics Cannot Tell You
It is worth being clear about the limits of what video analytics can and cannot provide, because the temptation to over-interpret the data is real. The camera can tell you how many people entered, where they went, how long they stayed, and at what times. It cannot tell you why they behaved the way they did. That distinction matters significantly in practice.
A cold spot in a heatmap; an area of the store where customers rarely linger; may indicate a merchandising problem, a display that is physically awkward to access, a product category that genuinely does not interest this particular customer base, poor lighting in that zone, or simply the natural flow dynamics of the store layout. The data identifies the pattern. It does not explain the cause. A retailer who responds to every cold spot by changing the merchandise without investigating the underlying reason may improve some areas and leave others unchanged because the real cause was never addressed.
Analytics identifies patterns. Human judgement explains them. The most effective use of retail analytics involves reviewing the data with staff who understand the store, testing changes methodically rather than implementing wholesale redesigns based on a single report cycle, and treating the analytics as one input into decision-making rather than as a substitute for it. The technology provides visibility. The decisions remain human ones.
KEY POINT
Analytics narrows the space of possible explanations by identifying patterns. It does not eliminate the need for human investigation of why those patterns exist. The two work together most effectively when both are taken seriously.
The Biggest Mistake; Data Nobody Uses
The most consistent failure mode I see in retail analytics implementations is not a technology problem. It is a process problem. Businesses invest in analytics-capable cameras and reporting platforms, generate the first few reports with interest, and then gradually stop reviewing the data as the novelty wears off and operational priorities compete for attention. Three months later, the dashboard is still running, the data is still accumulating, and nobody is acting on it.
This outcome is entirely avoidable but requires deliberate process design from the start. Who is responsible for reviewing the reports, and how often? What decisions are being informed by the analytics; staffing, layout, marketing, procurement? What is the process for translating a data finding into a test, and a test into a permanent change? If these questions are not answered before the system is deployed, the analytics capability will be technically present and operationally unused.
The value of retail analytics does not come from collection. It comes from action. A modest capability that is reviewed weekly and consistently informs one or two operational decisions per month delivers more business value than a sophisticated platform generating comprehensive reports that nobody has time to read.
KEY POINT
Before investing in analytics capability, define the decision it is intended to improve. If you cannot name a specific operational decision that better data would change, the analytics will not be used effectively regardless of how capable the technology is.
Is This Right for Every Retailer?
Not necessarily. For a single small retail unit with consistent operations and no immediate plans to change layout, staffing, or marketing strategy, the incremental value of adding analytics to a CCTV installation is modest. The investment in analytics-capable cameras and reporting infrastructure needs to be weighed against the operational decisions it will actually inform.
The case becomes progressively stronger as the number of outlets, the frequency of operational decisions, and the variability of performance across locations increases. A retailer with five or more outlets, regular promotional campaigns, and ongoing questions about why certain locations outperform others has a clear use case for every analytics capability described in this article. The data becomes more actionable as the comparison set grows; one outlet's heatmap is interesting, five outlets' heatmaps compared against each other reveal patterns that a single-site view cannot.
Securevision Verdict
The most interesting development in commercial CCTV over the past several years is that the cameras have become business tools as well as security tools. The same camera that prevents theft and provides incident evidence can also count visitors, map customer movement, measure dwell time, and support decisions about layout, staffing, and marketing effectiveness. For retailers who are already planning a CCTV upgrade, considering analytics-capable cameras adds meaningful capability at modest incremental cost.
The technology itself is not the goal. The goal is making better decisions. And sometimes the most valuable thing a camera records is not an incident. It is a pattern; one that, once visible, changes how a retailer thinks about the space, the people in it, and the decisions that determine whether the next month is better than the last.
In Short
The most useful thing that has happened to commercial CCTV in the past decade is that the cameras have become capable of counting, measuring, and reporting, not just recording. A retailer who uses this capability well has access to operational intelligence that was previously available only to large chains with dedicated analytics teams. The technology is not complicated to deploy, and the data it produces is genuinely useful, but only if someone in the organisation is responsible for reviewing it and acting on what it shows. A dashboard that nobody reads is worth no more than a blank screen.

Frequently asked questions
What is retail CCTV analytics?
Retail CCTV analytics refers to software that analyses camera footage to produce business intelligence; footfall counts, customer flow paths, dwell time by zone, conversion rates, and queue lengths. The cameras record as normal for security purposes, and the analytics engine processes the same footage to extract operational data that the retailer can use to make decisions about layout, staffing, and promotions.
What is footfall counting and how accurate is it?
Footfall counting uses overhead cameras at entry and exit points to count the number of people entering and leaving the store. Modern people-counting systems using AI detection are typically accurate to within two to five percent under normal conditions. Accuracy is affected by camera placement, lighting, crowding at entry points, and whether customers are travelling in groups.
What is a conversion rate in retail analytics?
Conversion rate is the percentage of people who entered the store and made a purchase. It is calculated by dividing the number of transactions by the footfall count. This metric separates the question of how many people visited from how many bought, which footfall numbers alone cannot answer.
What is a heatmap in CCTV analytics?
A heatmap is a visual representation of customer movement and dwell time across the store floor, generated from camera footage over a defined period. Areas where customers spend more time appear in warmer colours; areas they move through quickly or avoid appear in cooler colours. Heatmaps reveal which zones are attracting attention and which are underperforming.
Can retail analytics tell me if my store layout is working?
Yes, to a significant degree. By comparing footfall distribution across zones with sales data by zone, analytics can reveal whether high-traffic areas are converting to sales and whether certain sections of the store are being bypassed despite carrying products that should attract interest.
How does analytics help with staffing decisions?
Footfall data broken down by hour and day reveals when the store is busiest. This allows staffing rosters to be aligned with actual demand rather than estimated demand. Some systems also detect queue formation at service counters and alert staff when waiting time exceeds a threshold.
Can I use retail analytics to measure the impact of a promotion?
Yes. By comparing footfall, dwell time in the promoted zone, and conversion rates during a promotional period against a comparable prior period, analytics can indicate whether the promotion drove measurable changes in customer behaviour. This is more reliable than relying on sales figures alone.
What cameras do I need for retail analytics?
People counting requires overhead cameras at entry and exit points with a clear downward view. Heatmapping requires cameras with sufficient field of view to cover the zones being monitored. The analytics can run on cameras with onboard processing, on a compatible NVR, or on a dedicated analytics server that accepts feeds from existing cameras.
Is retail analytics subject to PDPA in Singapore?
Standard people counting and heatmapping that tracks movement without identifying individuals is generally considered aggregated statistical data rather than personal data, and does not trigger PDPA obligations. Face recognition or any process that identifies specific individuals is subject to PDPA.
How long does it take to install a retail analytics system?
For a small to medium retail space using existing cameras with a compatible analytics server, installation and commissioning typically takes one to two days. The system typically needs a settling period of one to two weeks to build a baseline of data against which subsequent periods can be compared.
What does a retail analytics system cost in Singapore?
The cost depends on the number of cameras, whether existing cameras can be used, and the analytics platform. A basic people-counting installation for a small retail space might start from around $2,000 to $4,000 installed. A more comprehensive system with heatmapping and zone analytics across a larger space will cost more. Contact us for a proposal based on your specific retail environment.